Equality Information Report 2015
Published 11 December 2015
Applies to England and Wales
1. Introduction
Land Registry provides the vital function of giving assurance and confidence to the property market, with the Land Register underpinning ownership of £4 trillion-worth of property across England and Wales, including providing security for more than £1 trillion of mortgage lending. Each year, Land Registry processes 7.2 million updates to the register and receives 24 million requests for information and 700,000 calls to its contact centre. Land Registry provides e-services to 12,000 organisations and 140,000 individual professional users.
Land Registry is required under Section 149 of the Equality Act 2010 (the public sector equality duty), and the Equality Act 2010 (Specific Duties) Regulations 2011, to publish annually information to demonstrate our compliance with the Public Sector Equality Duty.
The Public Sector Equality Duty requires public authorities to:
- eliminate discrimination, harassment and victimisation and any other conduct that is prohibited by or under the Act
- advance equality of opportunity between people who share a relevant protected characteristic and people who do not share it
- foster good relations between people who share a relevant protected characteristic and those who do not share it
We recognise the benefits in collecting equality information in order to understand the impact our policies and practices may potentially have on people with protected characteristics. In addition to collecting equality information across the protected characteristics, we also collect data in relation to working patterns.
This report provides aggregated information relating to our employees and provides a benchmark which enables us to measure progress in the future and identify priority areas for further research and action. It shows how we carry out our statutory duty to promote and monitor equalities.
For further information
If you require this document in an alternative format or more detailed information regarding raw equality data, please contact:
Diversity Team
HR Service Centre
PO Box 10452
Castle Wharf House
2 Canal Street
Nottingham
NG1 9JR
Email: [email protected]
Telephone: 0300 006 2523
2. Our staff
- Overall workforce
- Diversity data by grade
- Recruitment
- Promotion
- Development opportunities
- Maternity leave
- Leavers
- Performance markings
- Training and development
- Grievance and disciplinary
- Employee engagement
- Equal Pay Audit
The equality and diversity figures in this report are based on a headcount total of 4,421 members of staff on 31 March 2015 and are taken from Land Registry’s HR System unless otherwise stated. Staff on loan and not paid directly by Land Registry are not included in the analysis, nor are agency staff/contractors.
Data Quality
In order to gather reliable diversity data on Land Registry’s workforce, staff are asked to complete their diversity details confidentially online. Land Registry’s declaration project is a key campaign that has been introduced with the aim of encouraging remaining staff who haven’t done so to declare. We have already seen an increase in declaration rates for religious belief and sexual orientation but current rates of declaration for sexual orientation and religious belief are at 59% which is too low for detailed analysis. Therefore the detailed analysis does not contain a breakdown by these characteristics.
Table A presents an analysis of the quality of the data held at 31 March 2015 relating to protected characteristics.
Table A: Declaration rates held for Land Registry workforce
| Characteristic | % of workforce with data |
|---|---|
| Gender | 100 |
| Age | 100 |
| Ethnic origin | 94 |
| Disability | 98 |
| Religion and belief | 59 |
| Sexual orientation | 59 |
2.1 Overall workforce
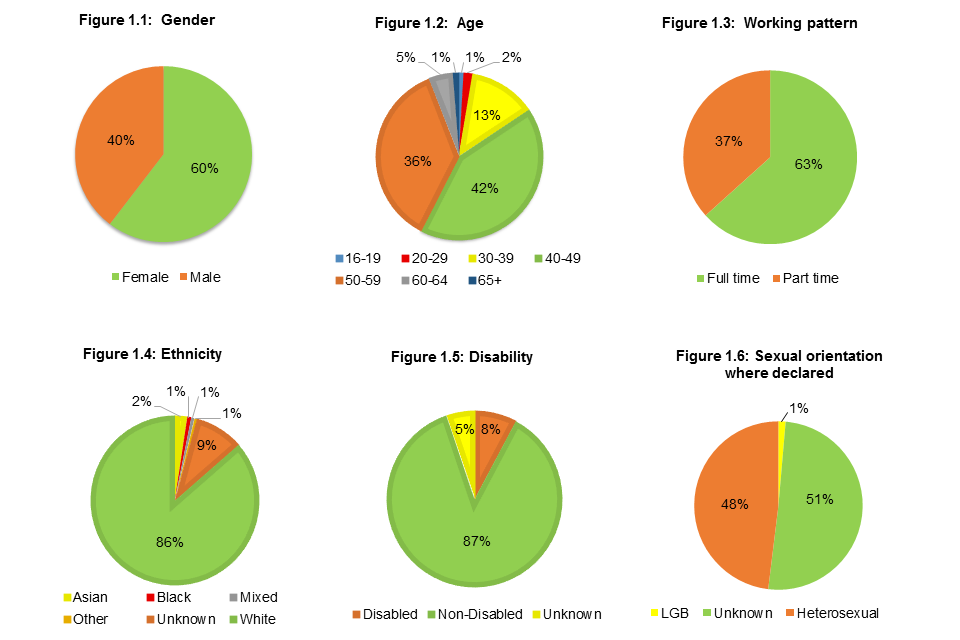
The data presented here shows Land Registry’s workforce by protected characteristic at 31 March 2015.
This tells us that:
- women account for 60% of the workforce
- 42% of the workforce are over 50, and a further 42% are aged between 40 and 49
- compared with the 2014 report, the percentage of the workforce that has declared themselves as from a minority ethnic background has remained at 4%. The number of staff that have chosen not to disclose their ethnic origin is 9%
- the number of staff declaring themselves as disabled has increased from 7.2% in 2014 to 7.8%
- part time workers comprise 37% of the workforce
- of the staff that have declared their sexual orientation, 1.4% have declared themselves as lesbian, gay or bisexual (LGB)
Workforce Composition
The following pie charts cover workforce composition by:
- gender (figure 1.1)
- age (figure 1.2)
- working pattern (figure 1.3)
- ethnicity (figure 1.4)
- disability (figure 1.5)
- sexual orientation where declared (figure 1.6)
2.2 Diversity data by grade
The data presented here shows Land Registry’s workforce by grade as percentages in relation to the protected characteristics and working pattern as at 31 March 2015.
There are 10 pay grades within Land Registry which are shown in the table below with the Civil Service equivalent grade. In addition in September 2014 Land Registry appointed 80 apprentices as part of a 2 year programme.
Table B: Grade structure
| Land Registry grade | Civil Service grade |
|---|---|
| Senior Civil Service (SCS) | SCS |
| Senior Registration Administrator 1 (SRA1) | Grade 6 |
| Senior Registration Administrator Lawyer (SRAL) | Grade 7 |
| Senior Registration Administrator 2 (SRA2) | Grade 7 |
| Senior Registration Executive (SRE) | Senior Executive Officer (SEO) |
| Registration Executive 1 (RE1) | SEO |
| Registration Executive 2 Upper (RE2U) | Higher Executive Officer (HEO) |
| Registration Executive 2 Lower (RE2L) | Executive Officer (EO) |
| Registration Officer (RO) | Administrative Officer (AO) |
| Registration Assistant (RA) | Administrative Assistant (AA) |
| Apprentice (APP) | Apprentice |
Land Registry sets its own internal targets for the immediate feeder grades for the SCS. The targets for the year 2014/15 are shown in Table C.
The framework uses the following grade bands:
- Group A – RA and RO (equating approximately to AA and AO) and including apprentices
- Group B – RE2L and RE2U (EO and HEO)
- Group C – RE1 and SRE (SEO)
- Group D – SRA2 and SRA1 (G7 and 6)
- Group E – SRAL (G7 legal)
Table C: Land Registry targets 2015
| A RA/RO (AA/AO/APP) |
B RE2L/U (EO/HEO) |
C RE1 / SRE (SEO+) |
D SRA2/1(G6/7) |
E SRAL(G7 Legal) |
|
|---|---|---|---|---|---|
| Women: at 31.03.14 | 58% | 64% | 41% | 43% | 50% |
| Women: target 2015 | 50% | 50% | |||
| Women: at 31.03.15 | 56% | 64% | 41% | 44% | 50% |
| Minority ethnic: at 31.03.14 | 10% | 4% | 4% | 3% | 9% |
| Minority ethnic: target 2015 | 6% | 6% | 6% | ||
| Minority ethnic: at 31.03.15 | 8% | 4% | 4% | 5% | 10% |
| Disabled: at 31.03.14 | 17% | 7% | 5% | 6% | 7% |
| Disabled: target 2015 | 10% | ||||
| Disabled: at 31.03.15 | 11% | 8% | 5% | 6% | 8% |
This tells us that:
- 85% of the total workforce was in the grades RE2U and below
- the RA grade comprises fewer than 10 people which should be considered when interpreting grade data
- the overall distribution of grades has not changed since last year although the total headcount numbers have reduced slightly
- women account for 64% of employees in the RE2U grade and below and are in the majority in our main casework grades (group B). Groups C and D are still below the 50% target. However the percentage of women in grades SRA2 and SRA1 has increased by 1% from 2014
- on 31 March 2015 women represented 36% of the SCS
- there are some differentiations in the age profile according to grade. In the RE2U grade and below 59% of staff are under the age of 50 compared with 50% of the RE1 grade and above
- when examining the grade profile of our disabled staff in the RE2U grade and below 8% of staff have declared themselves as disabled, while at the RE1 grade and above the proportion was 6%. All groups with the exception of A are below the 10% target, group B and group E have seen an increase of 1% of staff declaring themselves as disabled
- on 31 March 2015 no SCS had declared a disability
- the distribution across grades in relation to minority ethnic background is fairly even, with 4.1% being from a minority ethnic background in the RE2U grade and below and 4.8% in the RE1 grade and above. Groups B, C and D are below the target set, the SRA2 and SRA1 grades have seen an increase of 2% since 2014
- 9% of the SCS are from a minority ethnic background, but the numbers in the SCS grade are less than 15.
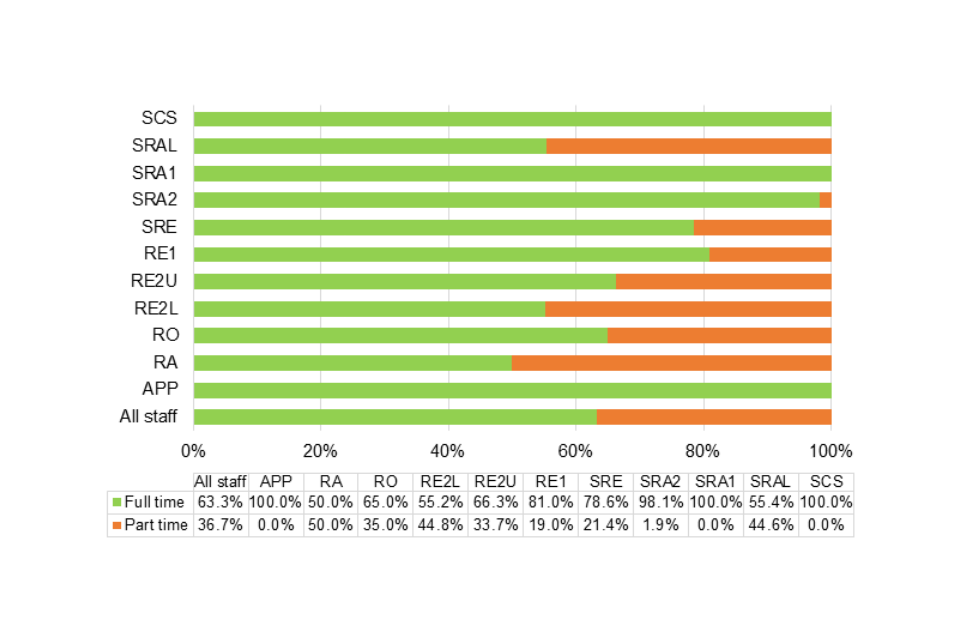
- in the grades RE2U and below, 40% of staff work less than full time. This figure halves for grades above RE1 where 20% of staff work part time.
Figure 2.1: Percentage of Land Registry staff across grades
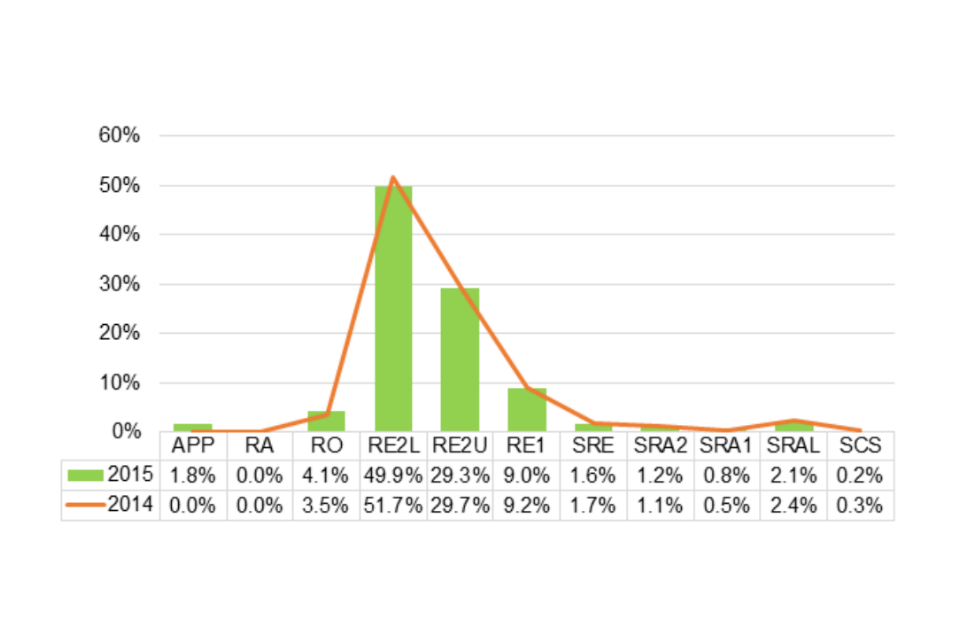
Figure 2.2: Gender distribution by grade
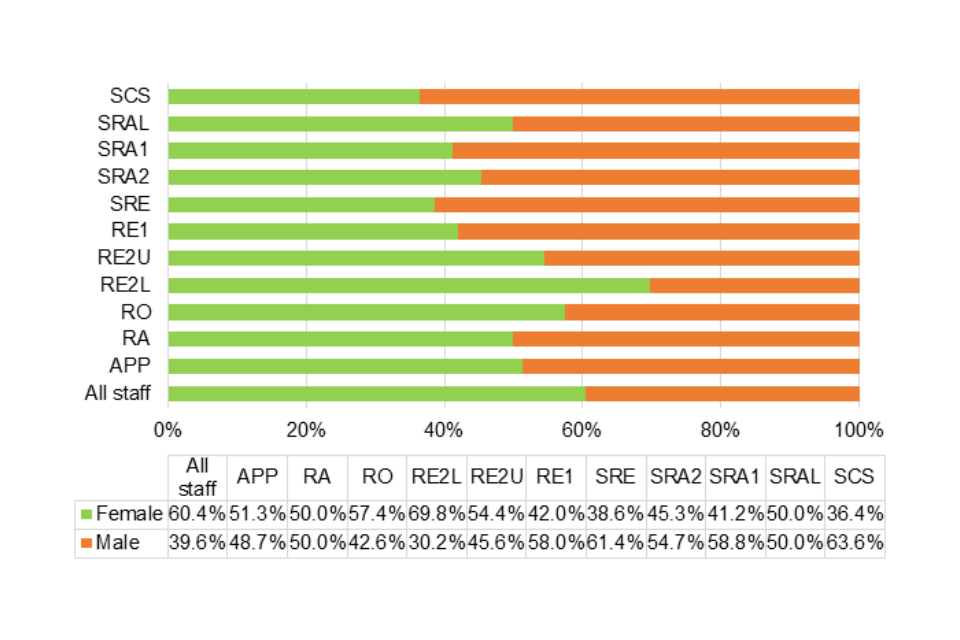
Figure 2.3: Age distribution by grade
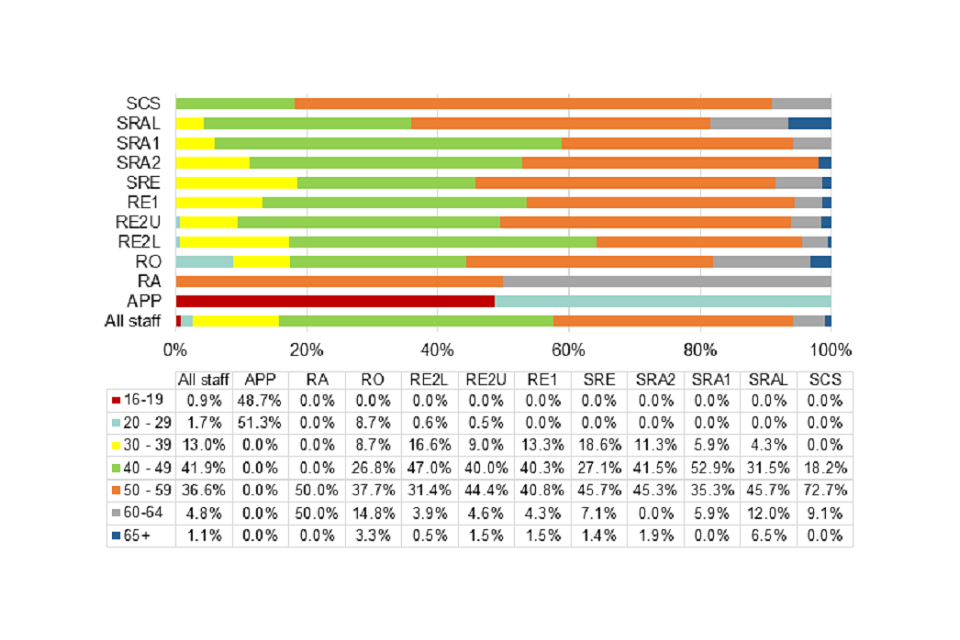
Figure 2.4: Disability distribution by grade
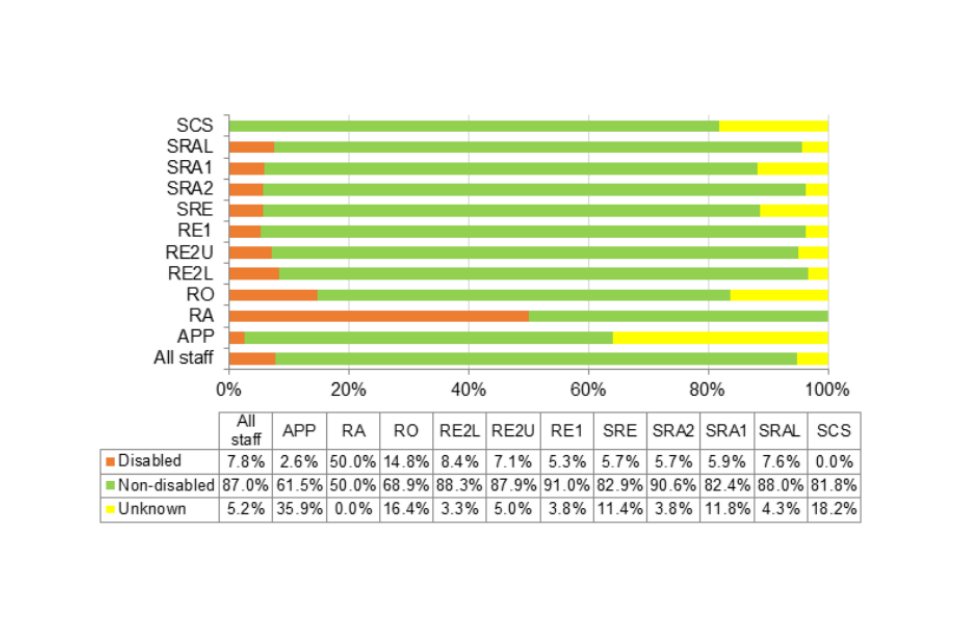
Figure 2.5: Ethnicity distribution by grade
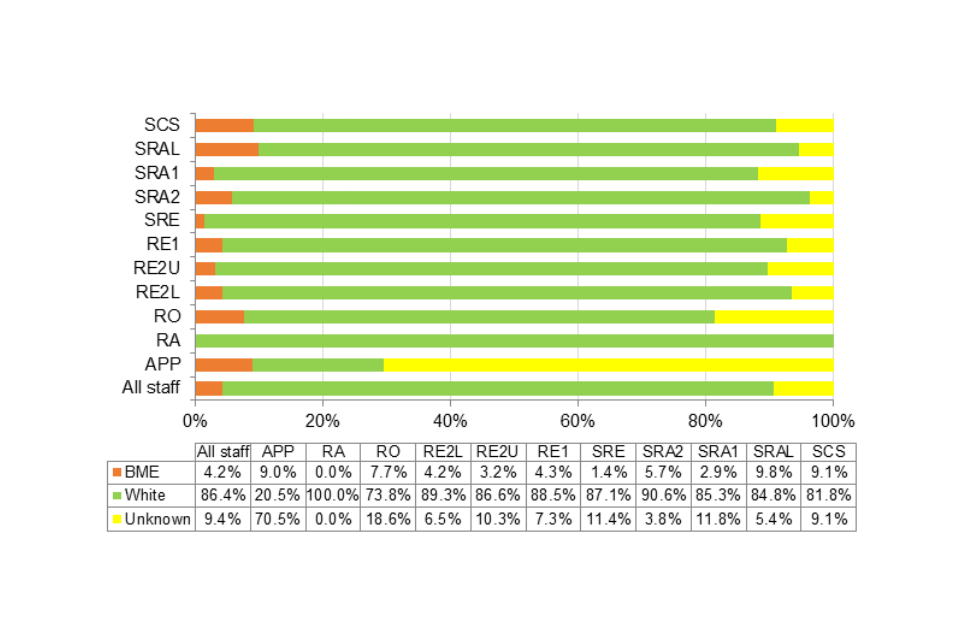
Figure 2.6: Working pattern distribution by grade
2.3 Recruitment
The data below shows the percentage of applicants at different stages of the recruitment process for vacancies advertised Civil Service-wide and externally which were filled between 1 April 2014 and 31 March 2015. This is shown against their status in relation to each of the following protected characteristics: gender, ethnicity and disability. The raw data is provided by Civil Service Resourcing.
This tells us that:
- the success rates for male and female applicants were roughly the same as is the case for ethnicity
- the success rate for applicants with a disability was lower than for non-disabled applicants. However the high percentage of unknowns means that we cannot draw any conclusions
Figure 3.1: Percentage of applicants at different stages of the recruitment process by gender
| Gender | % Application received | % Selected for Interview/Assessment Centre | % Successful |
|---|---|---|---|
| Female | 42.1 | 43.8 | 48.1 |
| Male | 57.7 | 56.3 | 51.9 |
| Unknown | 0.2 | 0 | 0 |
| Total | 100 | 100 | 100 |
The success rate for males was 10.2% and 12.9% for females.
Figure 3.2: Percentage of applicants at different stages of the recruitment process by ethnicity
| Ethnic origin | % Application received | % Selected for Interview/Assessment Centre | % Successful |
|---|---|---|---|
| Minority ethnic | 13.3 | 11.3 | 11.7 |
| White | 85.2 | 88.0 | 87.0 |
| Unknown | 1.5 | 0.7 | 1.3 |
| Total | 100 | 100 | 100 |
The success rate for applicants from a minority ethnic background was 9.9% and 11.5% for applicants who indicated that they were white.
Figure 3.3: Percentage of applicants at different stages of the recruitment process by disability
| Disability | % Application received | % Selected for Interview/Assessment Centre | % Successful |
|---|---|---|---|
| Disabled | 7.0 | 4.3 | 2.6 |
| Non-disabled | 87.6 | 89.7 | 91.6 |
| Unknown | 5.4 | 6.0 | 5.8 |
| Total | 100 | 100 | 100 |
The success rate for applicants with a disability was 4.2% compared to 11.8% for non-disabled applicants. However the high percentage of unknowns means that we cannot draw any conclusions.
2.4 Promotion
The data analysis presented here shows employees promoted in relation to the protected characteristics: disability, ethnic origin and gender during the period 1 April 2014 to 31 March 2015. Working pattern has also been included.
Between 1 April 2014 and 31 March 2015, 76 staff at Land Registry gained promotion.
This tells us that:
- there has been an increase in promotion percentages for each protected characteristic except for part time workers which has decreased slightly
- the percentage of employees in protected groups promoted is similar to those promoted outside of the protected characteristic
- however, this is not the case for part time workers. This is due to fewer part time staff applying for promotion and the reasons for this require further analysis
Figure 4.1: Promotion by gender
| Gender | % of promotions by gender group See note 1 |
% of total headcount by gender group See note 2 |
% of gender group promoted See note 3 |
|---|---|---|---|
| Female | 55.3 | 60.4 | 1.6 |
| Male | 44.7 | 39.6 | 1.9 |
| Total | 100 | 100 | - |
Figure 4.2: Promotion by ethnicity
| Ethnic origin | % of promotions by ethnic origin group See note 1 |
% of total headcount by ethnic origin group See note 2 |
% of ethnic origin group promoted See note 3 |
|---|---|---|---|
| Minority ethnic | 3.9 | 4.2 | 1.6 |
| White | 90.8 | 86.4 | 1.8 |
| Total | 94.7 | 90.6 | - |
Figure 4.3: Promotion by disability
| Disability | % of promotions by disability status See note 1 |
% of total 2 headcount by disability group See note 2 |
% of disability group promoted See note 3 |
|---|---|---|---|
| Disabled | 7.9 | 7.8 | 1.7 |
| Non-disabled | 90.8 | 87.0 | 1.8 |
| Total | 98.7 | 94.8 | - |
Figure 4.4: Promotion by working pattern
| Working Pattern | % of promotions by work pattern See note 1 |
% of total headcount by work pattern group See note 2 |
% of work pattern group promoted See note 3 |
|---|---|---|---|
| Full time | 89.5 | 63.3 | 2.4 |
| Part time | 10.5 | 36.7 | 0.5 |
| Total | 100 | 100 | - |
Notes:
- Percentages shown are the number of employees promoted by protected characteristic over the total number of employees promoted.
- Organisational profile for protected characteristic.
- Percentages shown are the number of employees promoted by protected characteristic over the total number of employees in the organisation that have declared the protected characteristic. An even distribution is shown where the figures for the protected characteristic and outside the protected characteristic are equal.
2.5 Development opportunities
The data analysis presented here shows employees who were on temporary promotion between 1 April 2014 and 31 March 2015 in relation to the protected characteristics: disability, ethnic origin and gender. Working pattern has also been analysed.
There were 172 employees recorded as being on temporary promotion for any period during 2014/15.
This tells us that:
- there has been an increase in temporary promotion percentages for female and minority ethnic staff.
- this sees gender and ethnicity representation getting closer to their demographic profiles in the workforce.
- part time worker percentages on temporary promotion have increased to 14.5% compared with 13% in the previous year, though this is still below the demographic profile of 36.7%
- the success level for disabled staff is lower than last year. However the percentage of unknowns should be taken into account and the figure is still at a similar level to the representation in the workforce.
Figure 5.1: Temporary promotion by gender
| Gender | % of promotions by gender group See note 1 |
% of total headcount by gender group See note 2 |
% of gender group promoted See note 3 |
|---|---|---|---|
| Female | 54.1 | 60.4 | 3.5 |
| Male | 45.9 | 39.6 | 4.5 |
| Total | 100 | 100 | - |
Figure 5.2: Temporary promotion by ethnicity
| Ethnic origin | % of promotions by ethnic origin group See note 1 |
% of total headcount by ethnic origin group See note 2 |
% of ethnic origin group promoted See note 3 |
|---|---|---|---|
| Minority ethnic | 3.5 | 4.2 | 3.2 |
| White | 89.5 | 86.4 | 4.0 |
| Total | 94.7 | 90.6 | - |
Figure 5.3: Temporary promotion by disability
| Disability | % of promotions by disability status See note 1 |
% of total headcount by disability group See note 2 |
% of disability group promoted See note 3 |
|---|---|---|---|
| Disabled | 5.2 | 7.8 | 2.6 |
| Non-disabled | 90.7 | 87.0 | 4.1 |
| Total | 98.7 | 94.8 | - |
Figure 5.4: Temporary promotion by working pattern
| Working Pattern | % of promotions by work pattern See note 1 |
% of total headcount by work pattern group See note 2 |
% of work pattern group promoted See note 3 |
|---|---|---|---|
| Full time | 85.5 | 63.3 | 5.3 |
| Part time | 14.5 | 36.7 | 1.5 |
| Total | 100 | 100 | - |
Notes:
- Percentages shown are the number of employees promoted by protected characteristic over the total number of employees promoted.
- Organisational profile for protected characteristic.
- Percentages shown are the number of employees promoted by protected characteristic over the total number of employees in the organisation that have declared the protected characteristic. An even distribution is shown where the figures for the protected characteristic and outside the protected characteristic are equal.
2.6 Maternity leave
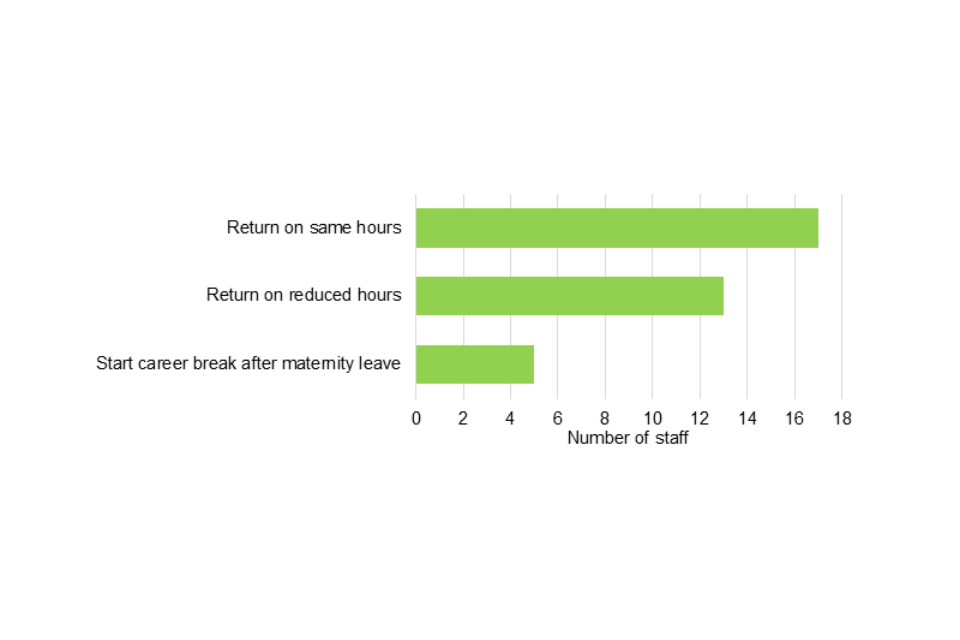
The data presented in this section shows the choices made by staff at the end of maternity leave between 1 April 2014 and 31 March 2015. There were 35 members of staff whose maternity leave ended in this period. Staff have been included as returning on reduced hours if they reduce their hours within two months of their maternity leave finishing.
This tells us that:
- none of the staff whose maternity leave ended in 2014/15 chose to leave Land Registry following maternity leave.
- 49% of staff returned on the same hours.
- 37% returned on reduced hours.
- 14% of staff started a career break straight after their maternity leave ended.
Figure 6.1: Return from maternity leave
2.7 Leavers
The data analysis presented here shows the reasons why employees leave the organisation in relation to each of the following protected characteristics: gender, ethnicity and disability. Working pattern has also been included. Between 1 April 2014 and 31 March 2015, 224 staff left Land Registry.
This tells us that:
- the main reasons for leaving are retirement, redundancy and resignation
- the category other includes death in service, medical retirement, transfer to another Department and end of fixed term appointment
- there was a slightly higher percentage of leavers among male staff than the organisational profile would suggest.
- there was also a higher percentage of disabled staff and part time staff amongst the leavers than their representation in the workforce
- those declared under minority ethnic show a higher percentage in the other reason category. However the numbers are small and are obscured by those who have not declared
- those declared as disabled show a higher percentage of leavers through redundancy, again the numbers are small and are obscured by those who have not declared
- the percentage of part time staff taking retirement is higher than the total number leaving under this category although a number of people take up partial retirement prior to retiring may account for this
Figure 7.1: Percentage of reason for leaving by gender in relation to total number of leavers in that group
| Gender | % Dismissal | % Redundancy | % Resignation | % Retirement | % Other | % Total |
|---|---|---|---|---|---|---|
| Female | 6.1 | 29.8 | 21.4 | 28.2 | 14.5 | 100 |
| Male | 2.2 | 29.0 | 28.0 | 32.3 | 8.6 | 100 |
| % total leavers by reason | 4.5 | 29.5 | 24.1 | 29.9 | 12.1 | 100 |
Figure 7.2: Percentage of reasons for leaving by indicated ethnicity in relation to total number of leavers in that group
| Ethnicity | % Dismissal | % Redundancy | % Resignation | % Retirement | % Other | % Total |
|---|---|---|---|---|---|---|
| Minority ethnic | 0.0 | 11.1 | 33.3 | 11.1 | 44.4 | 100 |
| White | 4.6 | 31.5 | 21.8 | 32.5 | 9.6 | 100 |
| Unknown | 5.6 | 16.7 | 44.4 | 11.1 | 22.2 | 100 |
| % of total leavers by reason | 4.5 | 29.5 | 24.1 | 29.9 | 12.1 | 100 |
Figure 7.3: Percentage of reasons for leaving by indicated disability in relation to total number of leavers in that group
| Disability | % Dismissal | % Redundancy | % Resignation | % Retirement | % Other | % Total |
|---|---|---|---|---|---|---|
| Disabled | 0.0 | 41.7 | 12.5 | 29.2 | 16.7 | 100 |
| Non-disabled | 5.3 | 28.0 | 24.3 | 31.2 | 11.1 | 100 |
| Unknown | 0.0 | 27.3 | 45.5 | 9.1 | 18.2 | 100 |
| % of total leavers by reason | 4.5 | 29.5 | 24.1 | 29.9 | 12.1 | 100 |
Figure 7.4: Percentage of reason for leaving by working pattern in relation to total number of leavers in that group
| Working Pattern | % Dismissal | % Redundancy | % Resignation | % Retirement | % Other | % Total |
|---|---|---|---|---|---|---|
| Full time | 3.9 | 32.0 | 26.6 | 20.3 | 17.2 | 100 |
| Part time | 5.2 | 26.0 | 20.8 | 42.7 | 5.2 | 100 |
| % of total leavers by reason | 4.5 | 29.5 | 24.1 | 29.9 | 12.1 | 100 |
2.8 Performance markings
The information below shows the distribution of top performance markings by the protected characteristics: gender, ethnicity, disability and age. We have also included the results on working pattern. The 2014/15 performance management process comprised 3 performance ratings and the distribution is shown in the table below.
Table D: Distribution of performance ratings 2014/15
| Rating | % Distribution |
|---|---|
| Exceeded | 15.0 |
| Met | 80.8 |
| Must improve | 4.1 |
This tells us that:
- a higher percentage of all female staff were awarded ‘exceeded’ than men for the first time
- staff who had declared that they were not from a minority ethnic background were awarded a slightly higher percentage of top performance ratings. However the gap between minority ethnic staff and those who were not from a minority ethnic background in 2014/15 is not statistically significant
- in terms of disability there has been a decrease in the percentage of disabled staff receiving a top performance marking, down 0.4% from 9.2% to 8.8%. There is a widening gap in ‘exceeded’ markings for disability which requires further research and analysis
- there is a more even distribution of ‘exceeded’ markings across the grades
- when considering performance markings for staff working part time, based on the relative numbers of full-time and part-time staff, we would have expected more part-time staff to receive an ‘exceeded’ marking. The percentage of part- time staff receiving an ‘exceeded’ marking is still significantly lower than for full-time staff but the differential is beginning to decrease. It can be seen that this is a long-standing differential and action continues to try to identify and address the underlying causes.
Further analysis of the ‘exceeded’ markings show female staff have been awarded a higher percentage of top performance markings in both full and part-time categories - 48% of top performance markings were awarded to the 40-49 age groups, which is the largest age category for Land Registry staff as a whole. However, staff aged over 50 were awarded a significantly lower proportion of top performance markings
Figure 8.1: Top performance markings by gender
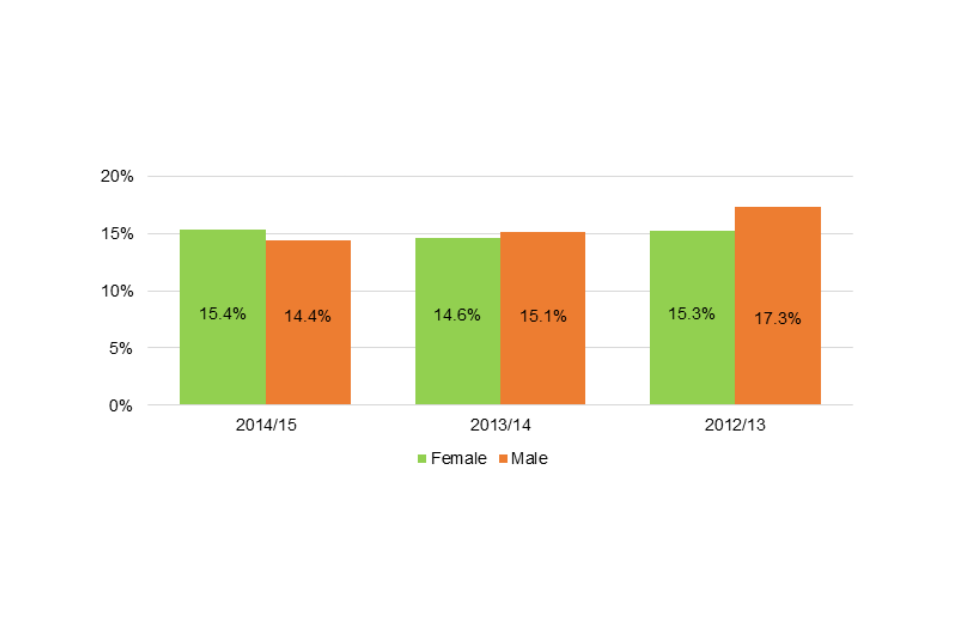
Figure 8.2: Top performance markings by ethnicity
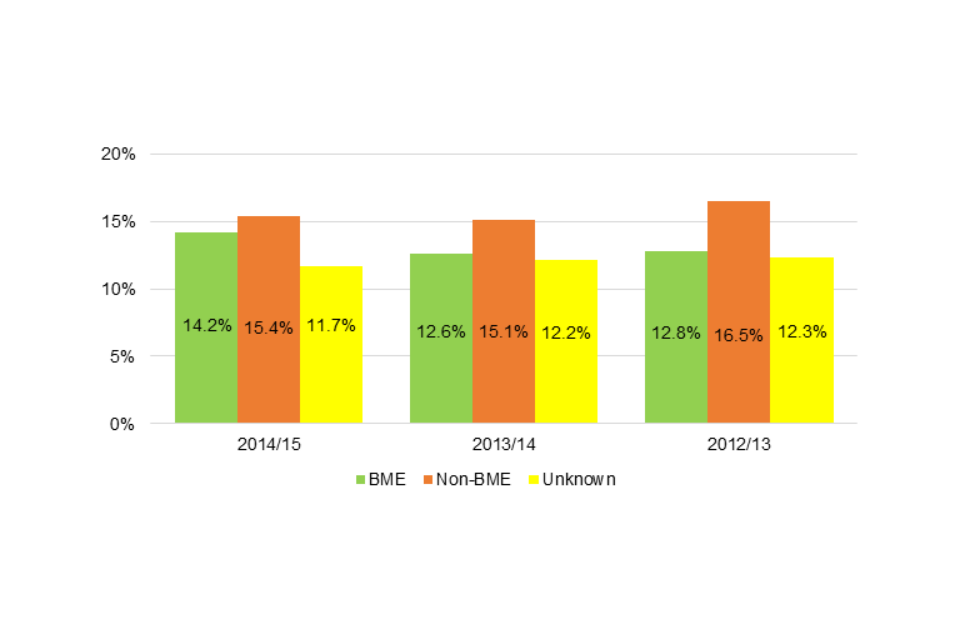
Figure 8.3: Top performance markings by disability
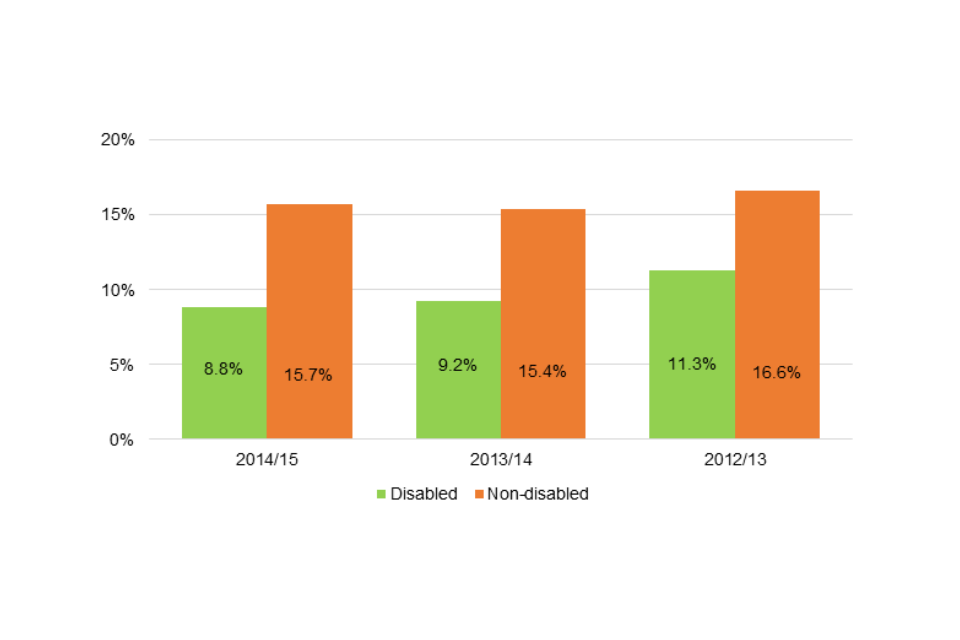
Figure 8.4: Top performance markings by grade
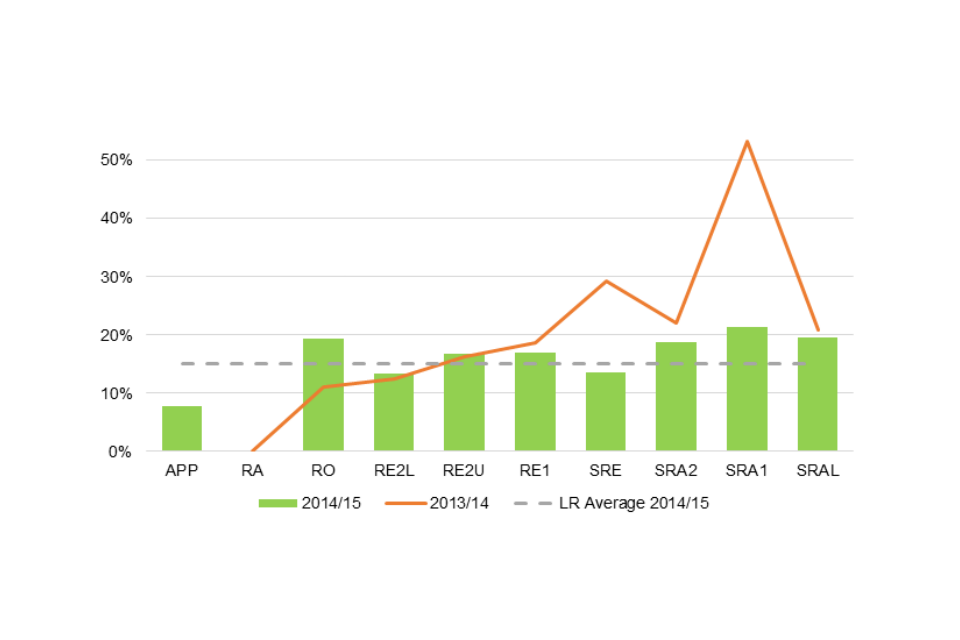
Figure 8.5: Top performance markings by working pattern
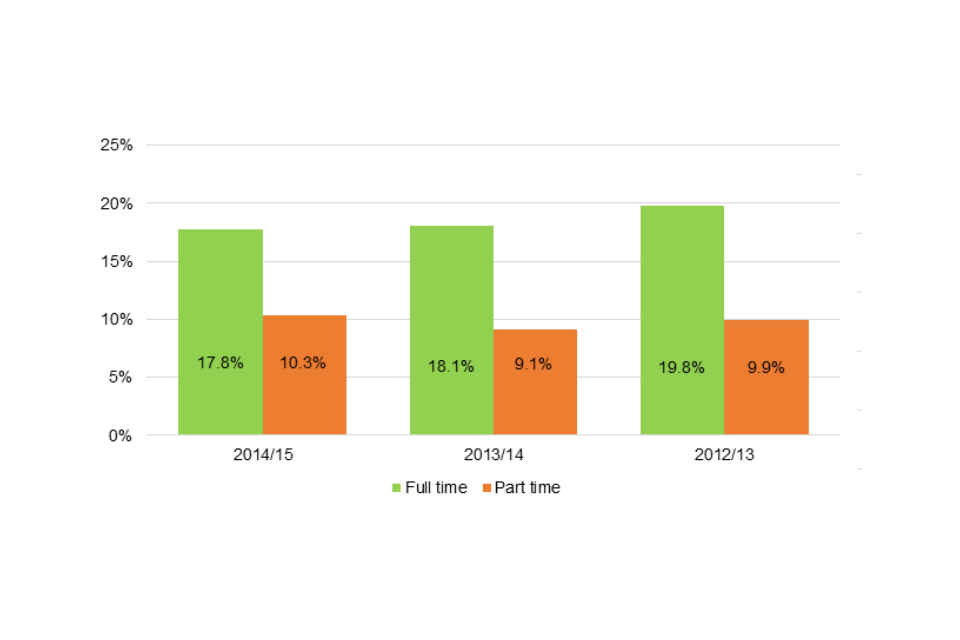
Figure 8.6: Top performance markings by age
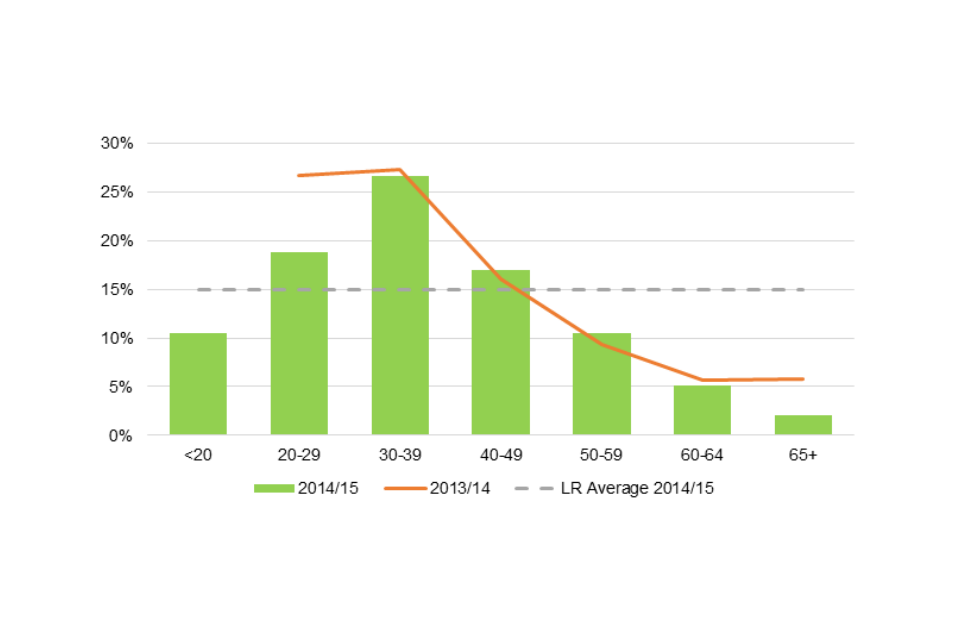
2.9 Training and development
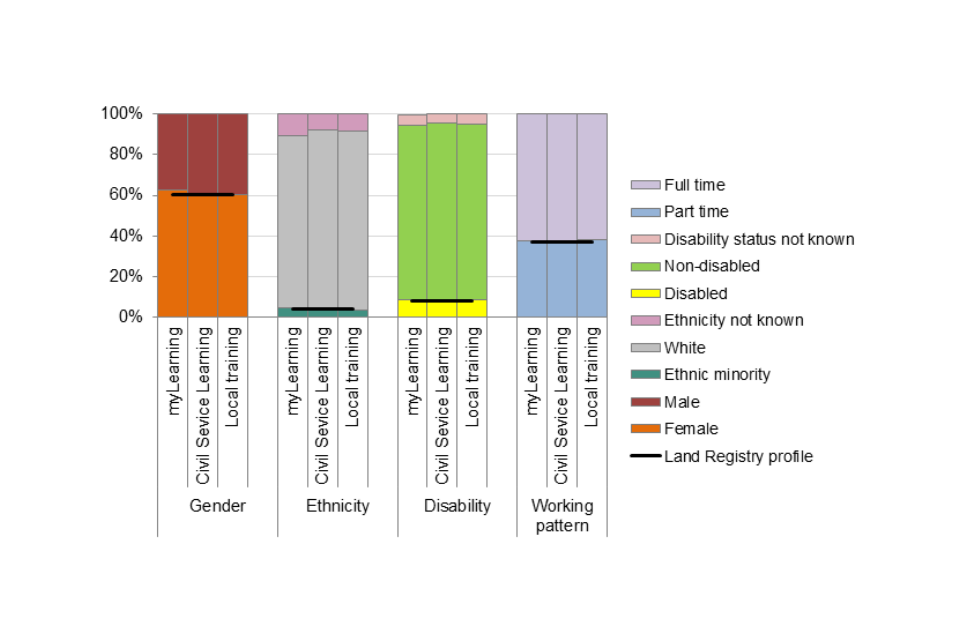
Land Registry is committed to developing its workforce and ensuring all staff have access to training and development. Data is collected from myLearning records, Civil Service Learning and from information collected at a local office level.
This tells us that:
- the diversity analysis in regard to receiving training demonstrates an equal distribution across all categories for all training channels and what we would expect to see in line with the workforce profile.
Figure 9.1: Training and development received by staff shown by gender, ethnicity, disability and work pattern
2.10 Grievance and disciplinary
Six formal grievances were raised during 2014/15.These figures do not include informal grievances which are dealt with by management at a local level and are not recorded centrally.
It is difficult to draw any conclusions as the numbers are so small. However two grievances were raised by female staff members, one raised by a member of staff who had declared a disability and one by a member of staff who had declared themselves as from a minority ethnic background.
Twelve formal disciplinary cases were recorded centrally in Land Registry between 1 April 2014 and 31 March 2015. Again, the numbers are too small to draw conclusions but six disciplinaries involved female staff, one member of staff who had declared themselves as from a minority ethnic background and one member of staff who had declared a disability. Compared with the 2014 report, the percentage of staff disciplined has declined for all groups.
2.11 Employee engagement
The results are taken from the Civil Service People Survey conducted in October 2014. Overall there were 1184 returns which is a 27% response rate. At the end of the survey staff were asked to complete a diversity monitoring form, which is voluntary. Not all members of staff who completed the survey itself disclosed their diversity information and of those who did fill out the diversity monitoring section, not all staff filled in all categories. From the data that was available, the following table shows their engagement index scores.
This tells us that:
- the engagement index score for each group increased from 2013, with the exception of staff who had declared that they were from an ethnic minority background and part time staff
- the response rate for ethnic minority staff was 19% compared with 43% last year and for part time staff was 21% compared with 58%. It is important to take this into account when looking at the data
Table E: Engagement index score 2014 by characteristic
| Engagement Index 2013 | Engagement Index 2014 | Engagement Index 2013: change 2013 - 2014 | ||
|---|---|---|---|---|
| Land Registry | All | 48 | 49 | +1 |
| Disability | Disabled | 43 | 45 | +2 |
| Non - disabled | 49 | 51 | +2 | |
| Gender | Female | 52 | 54 | +2 |
| Male | 45 | 47 | +2 | |
| Ethnicity | Minority ethnic | 54 | 46 | -8 |
| White | 49 | 51 | +2 | |
| Sexual Orientation | LGB | 45 | 48 | +3 |
| Heterosexual | 50 | 52 | +2 | |
| Working Pattern | Part time | 49 | 47 | -2 |
| Full time | 48 | 50 | +2 |
2.12 Equal Pay Audit
Land Registry conducted an Equal Pay Audit of employees in grades below the Senior Civil Service in July 2015, view the results of the audit.
3. Steps taken to ensure due regard to the Public Sector equality duty
Diversity for us is not an option: it is integral to our business as it helps to achieve fairness at work and enhances our service to the public. In order to achieve this, we have put a number of measures in place to enable us to monitor and improve our performance on equality and diversity issues.
3.1 How Land Registry delivers diversity
There are both external and internal drivers for diversity. The aim is to drive behavioural and cultural change and to articulate the business case for diversity across the service. The following summarises the various ways in which we deliver diversity and how we measure our success.
Governance structure
The Diversity Committee chaired by Graham Farrant, Chief Executive and Chief Land Registrar, provides strategic direction including the desired impact, measures of success and progress. The group is comprised of representatives from Operations Directorate, Head Office groups and the trade union side, along with the chairs of our diversity staff networks.
The Diversity Working Group, led by the Head of Diversity, proactively identifies and raises diversity related issues which affect staff and customers so they can be considered and addressed. The group act as advisers to the business on the equality analysis process and identify solutions to mitigate impact where necessary. This group is comprised of members of the Black Asian and Minority Ethnic (BAME) Employee Network, the Disability Employee Network (DEN), and the Lesbian Gay Bisexual and Transgender & Allies (LGBT) Network.
In addition to our Diversity Committee and Working Group, Land Registry has diversity champions at Board and Senior Management Team level. Our diversity champions act as leaders for diversity and equality. This includes acting as role models, taking action when appropriate and addressing behaviours when necessary.
Strategic equality objectives
Our equality objectives enable Land Registry to focus attention on the priority equality issues to enable the delivery of improvements in policy making, service delivery and employment.
Actions under our equality objectives are reviewed annually and the Diversity Committee monitors progress against how well we succeed in meeting the objectives.
We want to be ambitious and therefore have set two strategic overarching equality objectives, which form part of our Land Registry Business Plan. The equality objectives are four-year goals.
Internal equality objective: to drive a culture of inclusion and respect within Land Registry and positively seek to improve engagement with staff with protected characteristics.
The action plan that sits behind the overall objective for 2014/15 is split into four key areas:
-
Improve knowledge of our workforce.
-
Increase the diversity of our workforce through recruitment, talent and promotion practices so that it better reflects society.
-
Ensure Land Registry Connect products fully consider diversity implications.
-
Work with staff at all levels, up to and including the Land Registry Board, to increase personal learning and development of diversity and inclusion.
External equality objective: to equip our staff to identify, anticipate and satisfy our customers’ diverse needs by delivering products, services and channels at a cost we can both afford.
The action plan that sits behind the overall objective for 2013/14 is split into three key areas:
-
Customer understanding – improve understanding of the impacts of Land Registry’s service on diverse customer groups
-
New services – ensuring new digital services are accessible and useable by the widest range of customers, dealing effectively with those customers who cannot use digital services
-
Customer handling and service – improve the delivery of customer service and handling in line with the requirements of the Equality Act 2010 (EA) to diverse groups of customers.
3.2 Progress on Strategic Equality Objectives
We have continued to deliver our strategic equality objectives which form part of the Land Registry Business Plan.
One major activity this year has been the delivery of unconscious bias training to all line managers across the business. This training has focused on ensuring our managers identify and understand their bias when dealing with people issues, especially in terms of recruitment and managing performance.
Land Registry’s diversity working group, which combines staff network groups for minority ethnic, disabled and LGBT employees have continued to be proactive in identifying and raising diversity related issues, which affect employees and customers.
Our diversity working group has been involved in developing diversity assisted digital personas to enable our developers to think about our diverse customers when designing new digital services. The group has also participated in workshops reviewing new digital products at both Alpha and Beta stages to ensure our new digital services meet the government’s commitments under its digital inclusion strategy.
The Land Registry declaration project has formed a key activity as part of our internal equality objective, as understanding the composition of our workforce assists us when making business decisions and also ensures our HR activity is free from bias. This campaign has seen a further increase in declaration rates across all groups, with 59% of our employees declaring their sexual orientation and religion, 98% declaring their disability status and 94% declaring their ethnicity.
In order to encourage staff to declare across these categories we have produced an in-house video which explains why declaration is important to us and what we use declaration data for. We will continue to encourage those remaining employees that have yet to declare during 2015/16 and have adjusted our target to 100% declaration.
We have continued to deliver positive action programmes, including the ‘Pathways’ course aimed at junior staff with the aim of increasing the diversity profile within middle management grades. We expanded this course in 2014 to include ‘Women in Information Systems’ with an aim of increasing the number of women in senior management roles.
In addition to the ‘Pathways’ course, we have established reverse mentoring with our Diversity Board Champions.
We have undertaken a number of activities to create an inclusive culture. This has included launching Land Registry’s Straight Allies Programme to further support our LGBT colleagues in the workplace. In addition, local diversity champions have continued to deliver diversity related events across the business including events for Black History Month, International Day of the Disabled Person and LGBT History Month.
Finally our external equality objective has focused on ensuring we deliver the best service to our diverse customers. This has included a review of the way we handle customer complaints, relating to equality, along with revisions in our staff guidance for dealing with customers with particular needs. Diversity awareness workshops for our front line staff who work in our customer contact and citizen centres has also been delivered this year.
3.3 Diversity improvements for 2015/16
To ensure we continue to mainstream the diversity agenda across Land Registry our key priorities for 2015/16 are as follows:
- improve knowledge of our workforce and improve our declaration rates across the business in order to achieve 100% declaration
- challenge cultural attitudes within performance management by undertaking detailed analysis of performance in relation to our disabled employees
- increase the diversity of our workforce through recruitment, talent and promotion practises so that it better reflects society by ensuring we increase the diversity of applicants to vacancies, including apprentices programmes
- deliver Removing Barriers programme framework ensuring the recommendations within the Civil Service Talent Action Plan are integrated into our HR activity
- ensure Land Registry Change Programmes and policy reviews fully consider diversity implications
- work with staff at all levels, up to and including the Land Registry Board, to increase personal learning and development of diversity and inclusion
- continue to improve understanding of the impacts of Land Registry’s service on diverse customer groups
- ensure new digital services are accessible and useable by the widest range of customers, dealing effectively with those customers who cannot use digital services
- improve the delivery of customer service and handling to diverse groups of customers in line with the requirements of the Equality Act 2010 (EA)
- finally we will review our progress on our equality objectives in order to prepare a new suite of equality objectives for 2016-2020
4. List of figures and tables
- Table A: Declaration rates held for Land Registry workforce
- Table B: Grade structure
- Table C: Land Registry targets 2015
- Table D: Distribution of performance ratings 2014/15
- Table E: Engagement index score 2014 by characteristic
- Figure 1.1: Workforce composition by gender
- Figure 1.2: Workforce composition by age
- Figure 1.3: Workforce composition by working pattern
- Figure 1.4: Workforce composition by ethnicity
- Figure 1.5: Workforce composition by disability
- Figure 1.6: Workforce composition by sexual orientation
- Figure 2.1: Percentage of Land Registry staff across grades
- Figure 2.2: Gender distribution by grade
- Figure 2.3: Age distribution by grade
- Figure 2.4: Disability distribution by grade
- Figure 2.5: Ethnicity distribution by grade
- Figure 2.6: Working pattern distribution by grade
- Figure 3.1: Percentage of applicants at different stages of the recruitment process by gender
- Figure 3.2: Percentage of applicants at different stages of the recruitment process by ethnicity
- Figure 3.3: Percentage of applicants at different stages of the recruitment process by disability
- Figure 4.1: Promotion by gender
- Figure 4.2: Promotion by ethnicity
- Figure 4.3: Promotion by disability
- Figure 4.4: Promotion by working pattern
- Figure 5.1: Temporary promotion by gender
- Figure 5.2: Temporary promotion by ethnicity
- Figure 5.3: Temporary promotion by disability
- Figure 5.4: Temporary promotion by working pattern
- Figure 6.1: Return from maternity leave
- Figure 7.1: Percentage of reason for leaving by gender in relation to total number of leavers in that group
- Figure 7.2: Percentage of reasons for leaving by indicated ethnicity in relation to total number of leavers in that group
- Figure 7.3: Percentage of reasons for leaving by indicated disability in relation to total number of leavers in that group
- Figure 7.4: Percentage of reason for leaving by working pattern in relation to total number of leavers in that group
- Figure 8.1: Top performance markings by gender
- Figure 8.2: Top performance markings by ethnicity
- Figure 8.3: Top performance markings by disability
- Figure 8.4: Top performance markings by grade
- Figure 8.5: Top performance markings by working pattern
- Figure 8.6: Top performance markings by age
- Figure 9.1: Training and development received by staff shown by gender, ethnicity, disability and work pattern

