Personal protective equipment (PPE) made in the UK as at 1 December 2020
Published 9 March 2021
Applies to England
In the September 2020 PPE strategy, the Department of Health and Social Care (DHSC) said that by 1 December 2020, the amount of personal protective equipment (PPE) that is UK-made would be sufficient to meet 70% of the expected demand for PPE over the following 3 months.
These statistics show the volume of PPE supply that DHSC sourced from UK manufacturing for the 3 months from 1 December 2020. The figures are compared with the expected demand for PPE over the same period.
UK-made supply comprised 82% of the expected demand for PPE in England for the period 1 December 2020 to 28 February 2021. This figure does not include gloves, which were explicitly excluded from the September target.
Data collection
Data is sourced from operational information used to support the PPE programme, for supply of PPE during the 90-day period 1 December 2020 to 28 February 2021. Figures for UK-made supply are drawn directly from contractual agreements the PPE programme established with UK manufacturers by 1 December 2020.
Figures for demand over the same 3-month period are derived from internal modelling of demand for PPE, based on actual levels of usage during the COVID-19 pandemic and expected changes as modelled at 1 December 2020.
Data is collected for the 8 categories of PPE included in the target:
- aprons
- body bags
- clinical waste bags
- eye protection (goggles and visors)
- FFP3 face masks
- IIR face masks
- gowns
- chemicals for hand hygiene
Gloves are explicitly excluded from the target in the September 2020 strategy document.
Calculations
For some categories of PPE, the volume of UK-made PPE supplied exceeds the level of expected demand for the same time period. To give a representative view of the overall position, these supply figures are capped at 100% of demand in each category before being used in any calculations. This capped volume of UK-made PPE is then compared to PPE demand expected for the same 90-day period.
Proportion of UK make = ((capped) volume of UK-made supply of PPE)/(expected demand for PPE)
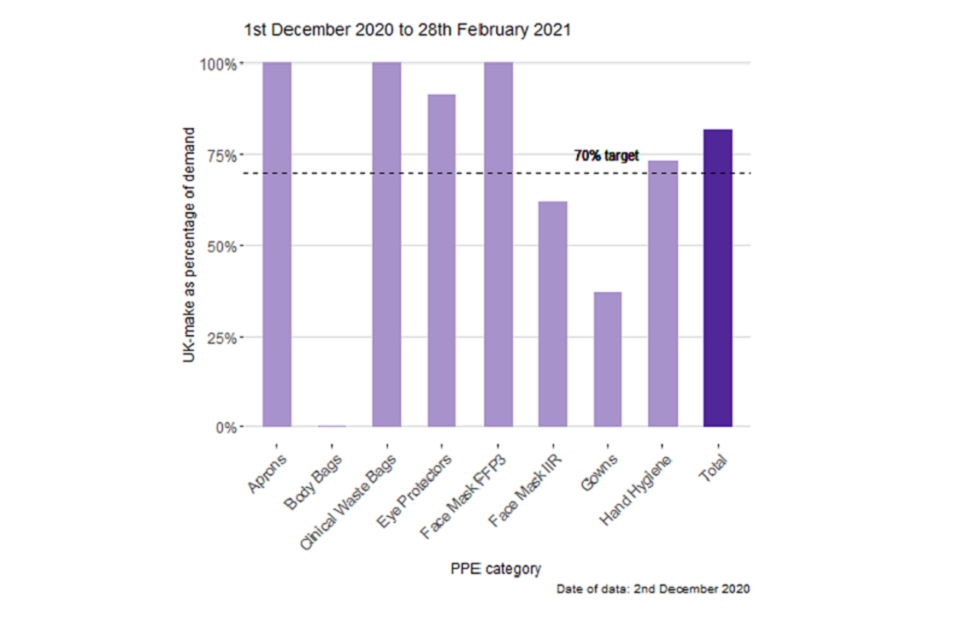
The percentage of UK-made PPE for each of the 8 categories, and the overall percentage, are given in Table A. Data is presented graphically in Figure 1.
Across all 8 categories, 82% of the total expected demand was met by UK-made products.
Table A: UK-made items of PPE, compared to expected demand for the 3 months 1 December 2020 to 28 February 2021
| Category of PPE | Expected demand for PPE (millions, except body bags) | Supply of UK-made products (millions) | Supply of UK-made products, capped at 100% of demand (millions) | UK-made PPE (capped) as percentage of demand |
|---|---|---|---|---|
| Aprons | 497.1 | 591.2 | 497.1 | 100% |
| Body bags | 25 k | 0.0 | 0.0 | 0% |
| Clinical waste bags | 10.9 | 32.3 | 10.9 | 100% |
| Eye protectors | 27.8 | 25.4 | 25.4 | 91% |
| Face mask FFP3 | 17.4 | 18.0 | 17.4 | 100% |
| Face mask IIR | 470.0 | 292.7 | 292.7 | 62% |
| Gowns | 14.1 | 5.2 | 5.2 | 37% |
| Hand hygiene | 2.8 | 2.1 | 2.1 | 73% |
| Total | 1,040.1 | 966.9 | 850.8 | 82% |
Numbers may not sum due to rounding.
Date of data: 2 December 2020
Figure 1: UK-made PPE (capped) as a percentage of expected demand for the 3 months 1 December 2020 to 28 February 2021

Email: [email protected]
