Results from the Labour in Horticulture Survey 2021 Quarter 3 for England
Updated 9 December 2021
Applies to England
This release shows the results from the Seasonal Labour in Horticulture Survey that collected data for the third quarter of 2021.
The results shown in this release are averages for those that responded to the survey. The results have not been weighted to account for the background population. Whilst there does not appear to have been any bias in response, some care should be taken when interpreting the results due to response rates.
Key messages for quarter 3 of 2021
- Approximately 43% of survey respondents needed seasonal labour.
- Average shortfall was 10% for survey respondents who needed seasonal labour.
- Average shortfall ranged from 39 person days in July to 61 in September for survey respondents who needed seasonal labour.
Key definitions
- Farms with horticulture are defined for this statistical release as those with fruit and vegetables grown outdoors for human consumption, Hardy Nursery Stock (HNS), bulbs and flowers in the open, or glasshouse and protected crops.
- Seasonal labour is employment which fluctuates or is restricted according to the season or time of the year.
- Shortfall in seasonal labour is the difference between seasonal labour need and actual use.
- Person days is a method of measuring labour, where 1 person day = 8 hours of work.
1. Detailed results
England, Quarter 3 (July to September)
The survey response rate for the third quarter was 15%, which was lower than expected but in line with previous years. Therefore, results should be treated with caution.
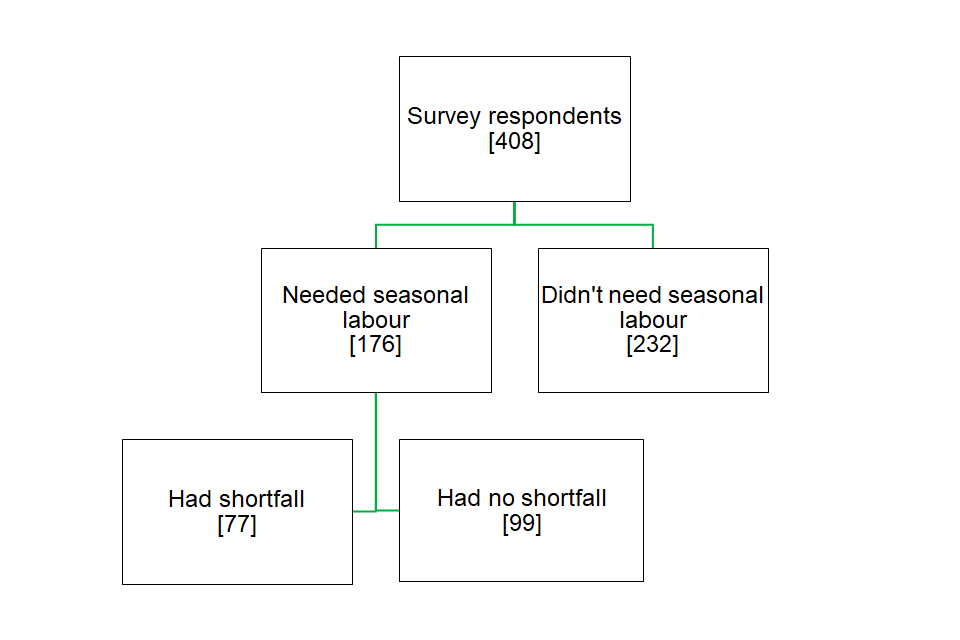
In the third quarter of 2021, out of the 408 farms with horticulture who responded, 232 had no need for seasonal labour (57%). Of the 176 survey respondents who did need labour, 44% reported a shortfall (see Figure 1). The average shortfall for the entire quarter per farm with horticulture who needed seasonal labour was 144 person days. This equates to a 10% shortfall.
The average need for labour increased throughout the third quarter from 446 person days in July to 503 person days in September. The average shortfall also increased throughout the quarter from 39 person days in July to 61 in September (see Table 1).
Figure 1: Breakdown of survey respondents with horticulture who needed seasonal labour and had a shortfall: July to September 2021

Table 1: Average quarterly and monthly need, use and shortfall per farm with horticulture for survey respondents with a need for seasonal labour: July to September 2021
| Person days needed | Person days used | Shortfall (Person days) | Shortfall (%) | Shortfall (People per day) | |
|---|---|---|---|---|---|
| Quarter 3 (n = 176) | 1,415 | 1,272 | 144 | 10 | 1.6 |
| July | 446 | 407 | 39 | 9 | 1.3 |
| August | 466 | 422 | 44 | 9 | 1.5 |
| September | 503 | 443 | 61 | 12 | 2.0 |
Notes
- Figures relate to average per farm with horticulture.
- Shortfall (People per day) is based on a 30 day month and 90 day quarter.
- The response rate for 2021 Quarter 3 was 15%. This was lower than expected, therefore results for this quarter should be treated with caution.
n: the number of survey respondents who needed seasonal labour within the quarter.
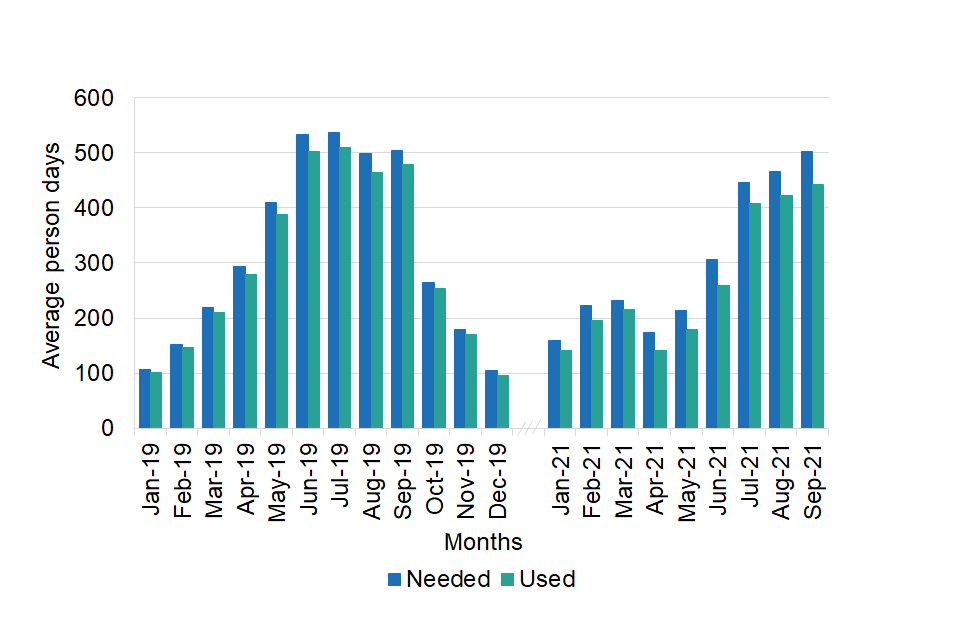
Figure 2: Average person days needed and used per farm with horticulture from January 2019 to September 2021 for survey respondents who needed seasonal labour

Note: In 2020 the survey did not run due to the COVID-19 pandemic, as a result no data is available. Additional information can be found in the methodology notes.
Figure 2 shows that there was a sudden increase in the need for seasonal labour from June to July 2021, whereas in 2019 the average need for labour remained steady into quarter 3.
The average person days needed and used by respondents in quarter 3 of 2021 was lower than the same quarter in 2019, but the percentage shortfall for the quarter increased from 6% in 2019 to 10% in 2021.
Table 2 shows the quarter 3 figures for 2018 to 2021 for comparison. The full monthly and quarterly results can be found in the accompanying dataset. Please note that the response rate for quarter 3 of 2021 was lower than expected compared to the same quarter in 2019 and 2018. Therefore, these results should be treated with caution.
Table 2: Average quarterly need, use and shortfall per farm with horticulture for survey respondents with a need for seasonal labour: in quarter 3 of 2018 to 2021
| Year | Person days needed | Person days used | Shortfall (Person days) | Shortfall (%) | Shortfall (People per day) |
|---|---|---|---|---|---|
| 2018 Quarter 3 (n=330) | 1,413 | 1,284 | 129 | 9 | 1.4 |
| 2019 Quarter 3 (n=258) | 1,540 | 1,451 | 89 | 6 | 1.0 |
| 2020 Quarter 3 | n/c | n/c | n/c | n/c | n/c |
| 2021 Quarter 3 (n=176) | 1,415 | 1,272 | 144 | 10 | 1.6 |
Notes
- Figures relate to average per farm with horticulture.
- There is no data available for 2020.
- Shortfall (People per day) is based on a 30 day month and 90 day quarter.
- The quarter 3 response rate was 15% for 2021, compared to 32% in 2018 and 18% in 2019. This was lower than expected, therefore results should be treated with caution.
n: the number of survey respondents who needed seasonal labour within the quarter.
n/c: not collected
2. What you need to know about this release
2.1 Background
The Seasonal Labour in Horticulture Survey is a voluntary, quarterly online survey that asks farms with horticulture how many person days their farm business needed from seasonal labour, and how many they actually used, in each month. Seasonal labour is defined in the survey as ‘those employed full-time or part-time on a casual / as required basis’. The survey began in early 2018 to assess any potential shortfall in seasonal labour on farms with horticulture.
2.2 Contact details
Responsible statistician: Emma Howat
Email address: [email protected]
Telephone: 03000 600170
Farming Statistics team
Department for Environment, Food and Rural Affairs
Foss House, Kings Pool
1-2 Peasholme Green
York YO1 7PX
2.3 Experimental statistics status
The results presented in this publication are classified as experimental statistics. Experimental Statistics are those that are within their development phase and are published in order to involve potential users at an early stage in building a high-quality set of statistics that meet user needs. The Experimental Statistics label highlights to users that Defra is still working on further developing the methodologies used in producing these statistics.
3. About these statistics
3.1 Why use person days?
Person days are collected instead of people as it provides a more consistent measure over time. For example, a team of 10 workers pick a crop on farm A, then when they finish, they do the same on farm B, followed by farm C. If asked how many people they needed, each farm would say 10 people, totalling 30 people, whereas it was the same 10 people who worked on them all.
3.2 Survey methodology
The population was approximately 6,500 horticulture holdings, defined as holdings who grew more than 0.1 ha of vegetables in the open, fruit, Hardy Nursery Stock (HNS), or more than 100m2 of protected crops as recorded in the 2019 June Survey of Agriculture and Horticulture.
The sample size was 2,644 for quarter 3 in 2021. To ensure a representative sample holdings were stratified by Standard Labour Requirement (SLR) band. In the SLR system, each livestock type and land-use has a theoretical amount of labour required each year. This value is multiplied by the land area or livestock numbers and then summed to give the SLR for the holding. The SLR represents the typical number of full-time workers required on the holding. Holdings were selected only if we held an email address as the survey was online only. The only exception is 2018 quarter 2, where those for whom we didn’t have an email address were added to the sample and were sent a card inviting them to complete the survey online.
| Sample (holdings) | Responses (holdings) | Response rate (%) | |
|---|---|---|---|
| 2018 Quarter 3 | 3,155 | 1,002 | 32 |
| 2019 Quarter 3 | 3,218 | 587 | 18 |
| 2020 Quarter 3 | n/c | n/c | n/c |
| 2021 Quarter 3 | 2,644 | 408 | 15 |
n/c: not collected
3.3 Data analysis
The data for the Seasonal Labour in Horticulture Survey are subject to rigorous validation checks which identify inconsistencies within the data. Any survey responses which accounted for multiple holdings (i.e. at a business level) were proportionally split across each holding using their respective SLR value and any individual holdings which did not meet our definition of horticulture farms were excluded from analysis.
3.4 2020 Statistical release cancellation notice
Due to the COVID-19 pandemic, data collection from the Seasonal Labour in Horticulture survey was temporarily paused to reduce the burden on farmers at this difficult time. As a result, there is no data available for 2020.
3.5 Other survey results and publications
Results from the Seasonal Labour in Horticulture Survey will be published quarterly.
4. Feedback
We welcome feedback and any thoughts to improve the publication further. Please send any feedback to: [email protected]. Suggested questions to help you structure your feedback are below but all feedback is welcome:
- How relevant is the current content of the publication to your needs as a user?
- What purpose do you require the data for?
- Which data do you find most useful?
- Is there any content that you did not find useful?
- Do you have any suggestions for further development of this release; including additional content, presentation and any other thoughts?
